


Employee Scheduling Software
Never Get Caught Short-Staffed Again
Organize your team, communicate information in real time and improve productivity with employee scheduling software. Speak to a representative, call 855-565-3291.
More than 40,000 businesses nationwide trust Paycor*

4.4/5 (2,762 Reviews)
Paycor provides more services than just payroll. We have the HR feature, the time keeping feature, reports, there’s so many different things that Paycor can offer.

LORI SEIBERT
HR Manager
Cincinnati Bengals
With Paycor’s onboarding solution, adding new hires takes me very little time. I also love that you can store documents online.

LAURA SPRADLEY
Director of Brand Development
Goo Goo Cluster
The overall experience is good as the program fulfills its purpose well, making life easier for companies that need payroll software.

NANCY FLIPPIN
CFO
MANNA Foodbank
Working with Paycor has cut our payroll processing time down from almost a full day to one hour. We also have more visibility.

AMANDA D.
Marketing Director
Hospital & Health Care
Paycor is more than just a time-keeping software. Employees can put in their hours and PTO requests, and can see their pay stubs and benefits.

LINA M.
Hospital Administrator
Hospital & Health Care
The software is rapidly updated with changes of times such as setting up new earnings codes for COVID related leaves. Easy to use.

LINCOLN M.
Financial Assistant
Non-Profit Organization
Efficient + Consistent Scheduling Matters
Manually keeping track of work schedules is time consuming and risky. One small error could impact coverage and hurt productivity. Take control of labor costs, streamline your scheduling process and improve productivity with a tool that simplifies scheduling complexities, optimizes staffing and increases employee engagement.
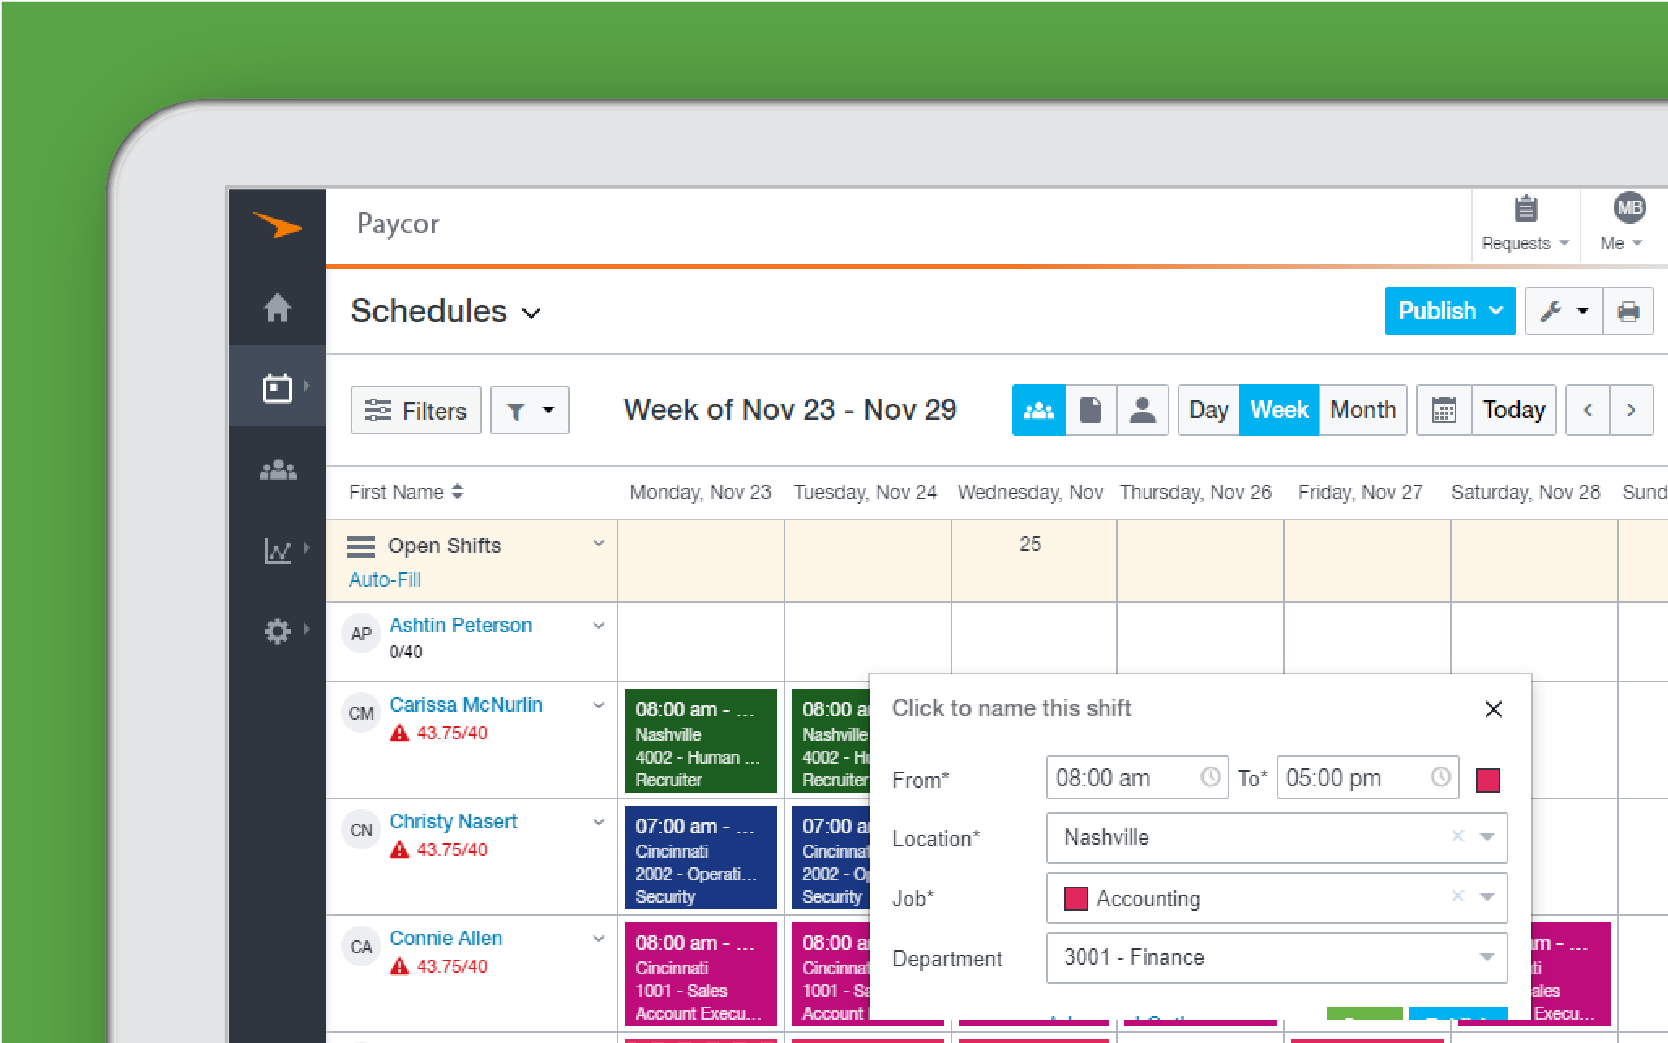
Faster Scheduling —
Create reliable schedules you can edit anytime and create templates and assign shifts with only a few clicks.
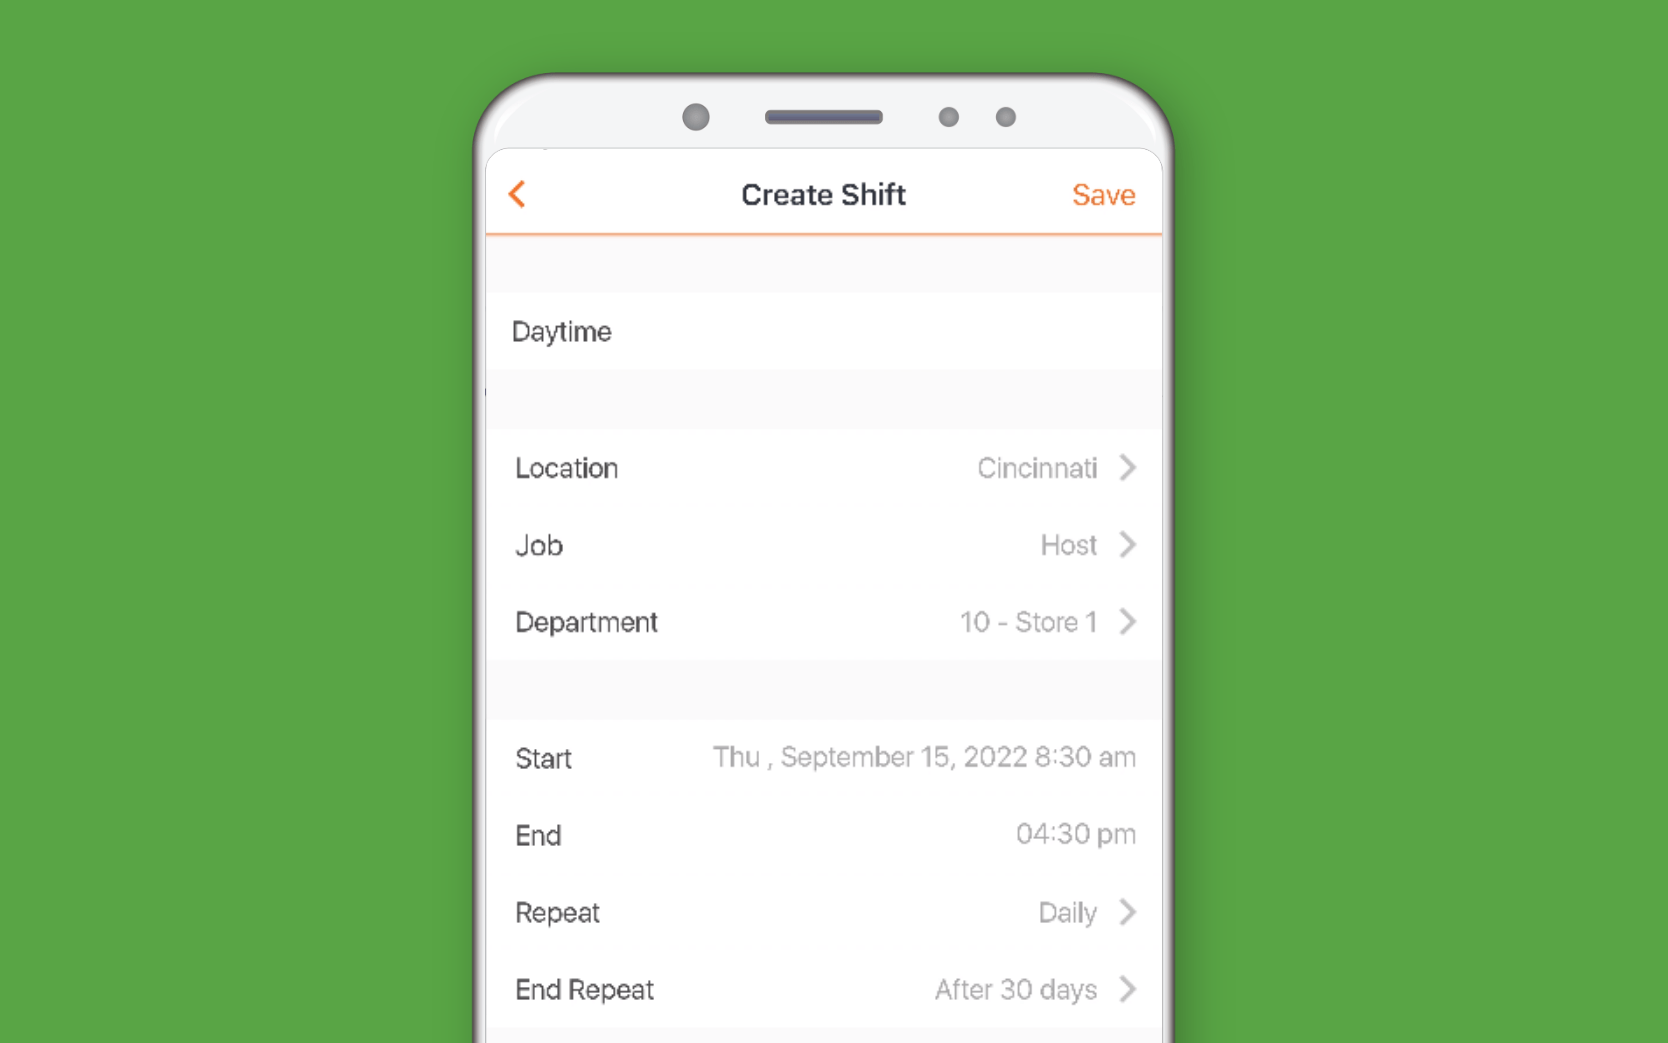
Mobile Scheduling —
Use your mobile device to schedule employees from any location and keep your team organized.
Complete Visibility —
Send real-time notifications and shift reminders via email or from your mobile device.
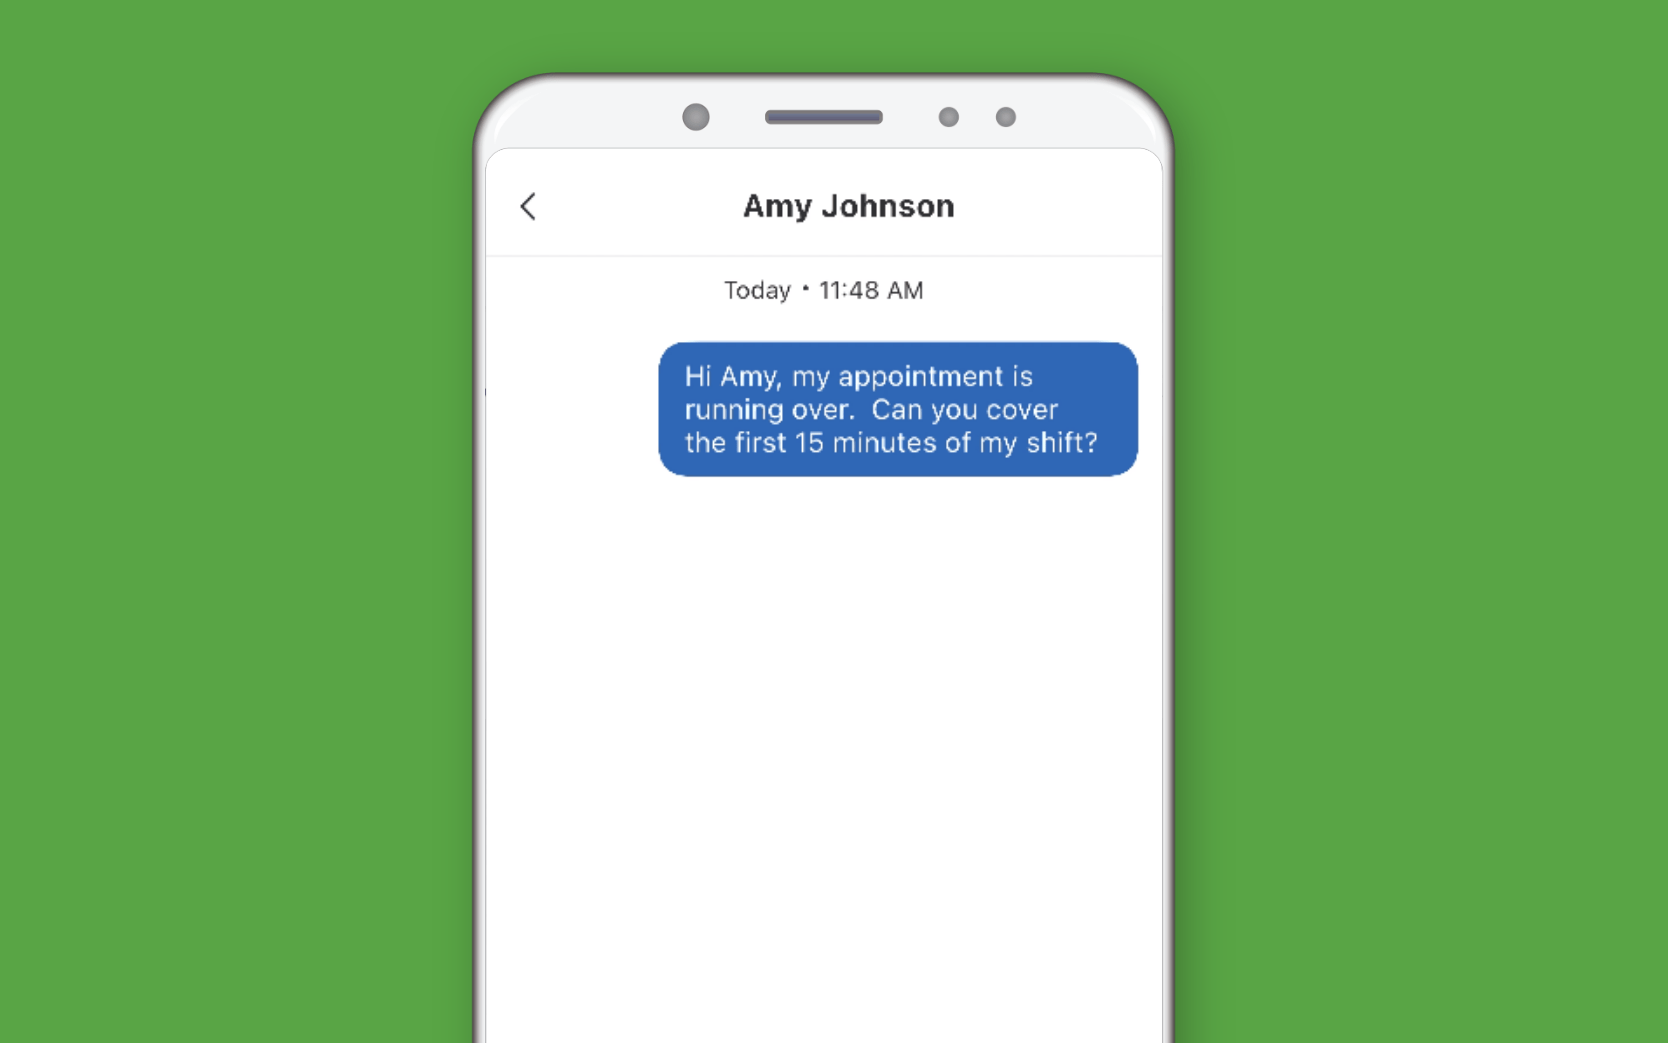
Eliminate Missed Shifts —
Optimize coverage by allowing employees to proactively set their availability and easily swap shifts.
Prevent Scheduling Headaches
Paycor Scheduling offers HR leaders the flexibility to customize schedules, improve budget management and communicate critical details to your workforce. Explore our scheduling tool to see how it can impact your organization.
Make Smart Staffing Decisions
In one year alone, managers spend nearly 140 hours manually creating schedules and updating employee schedules. Relying on spreadsheets to organize your team and manage their availability is time consuming and error prone. See how Paycor helps eliminate unexpected absences across your workforce to make your scheduling process more efficient and consistent.
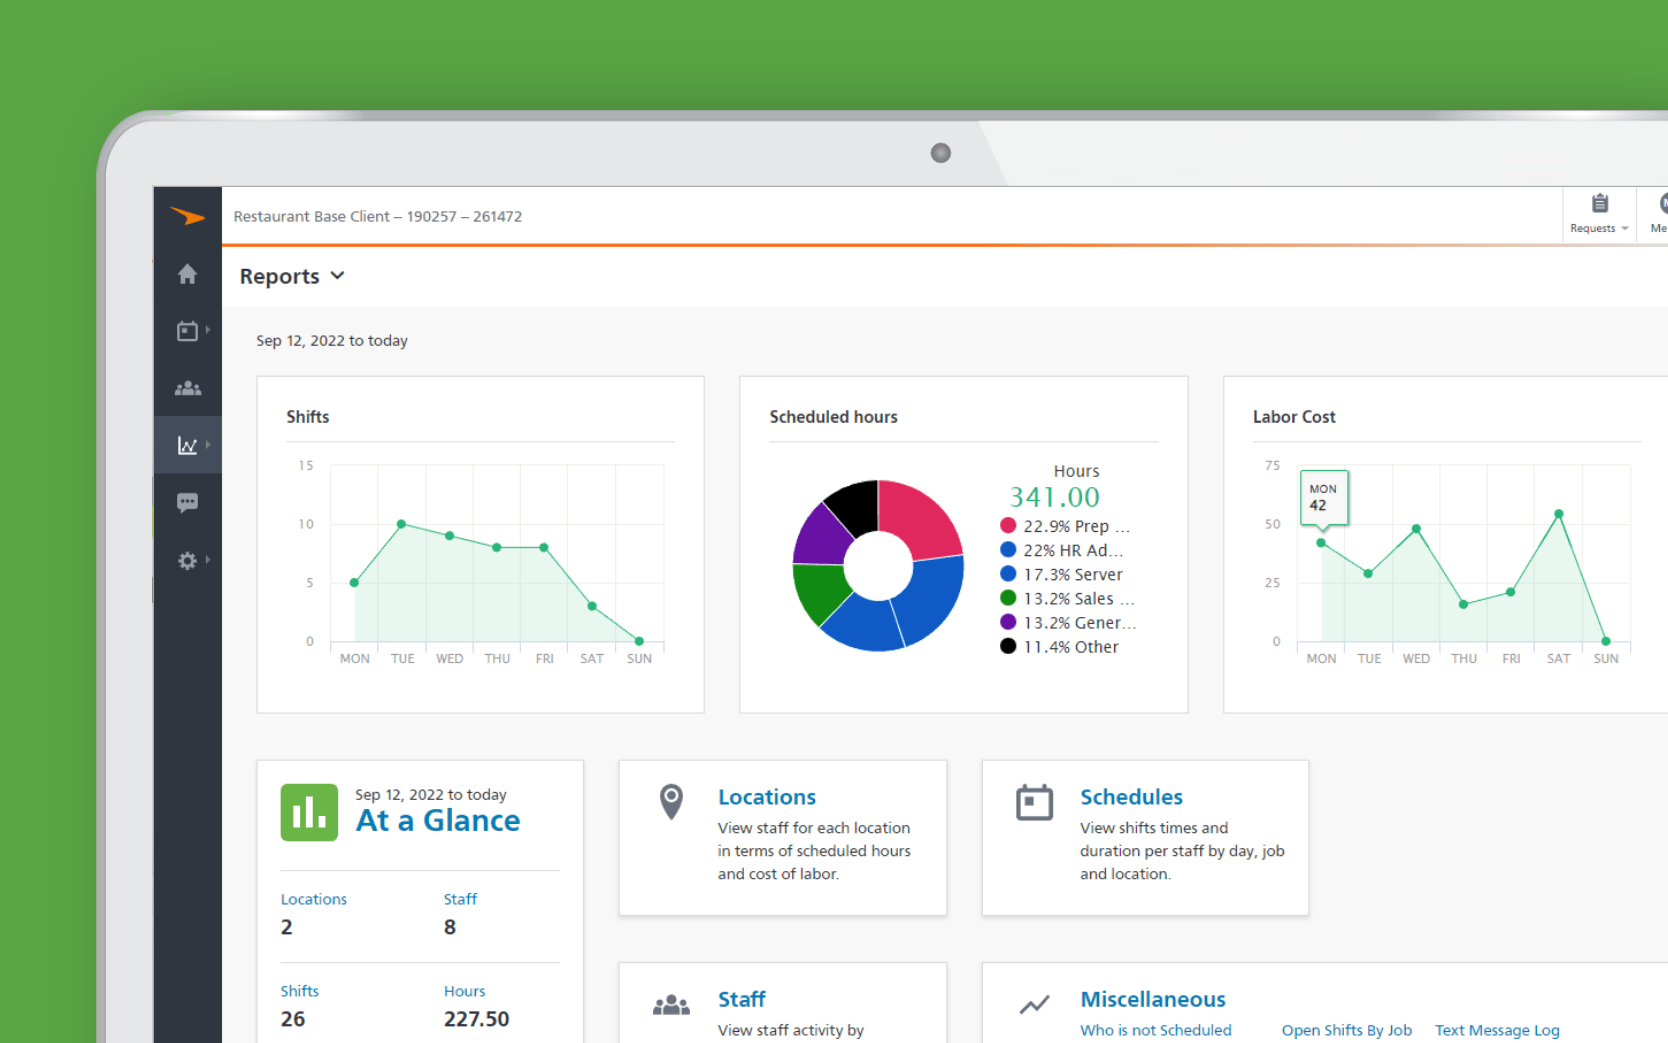
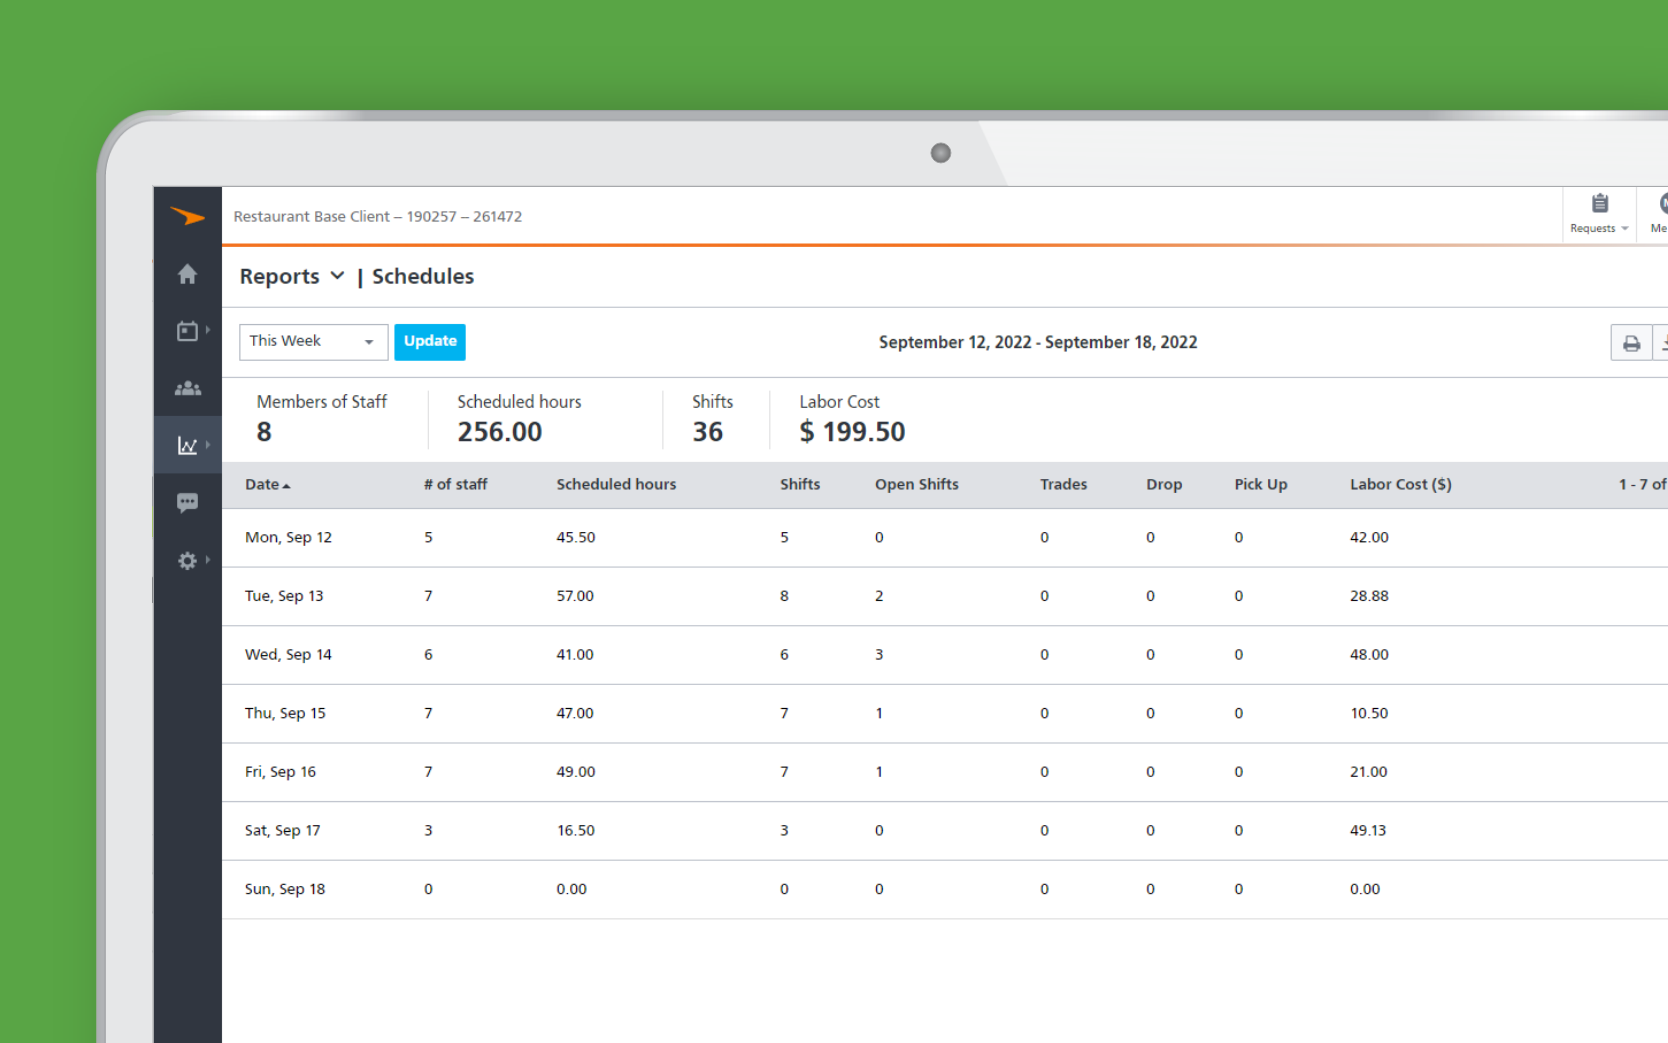
Advanced Reporting —
Overstaffing or understaffing can create costly mistakes. Simple reporting provides insight into hours and costs.
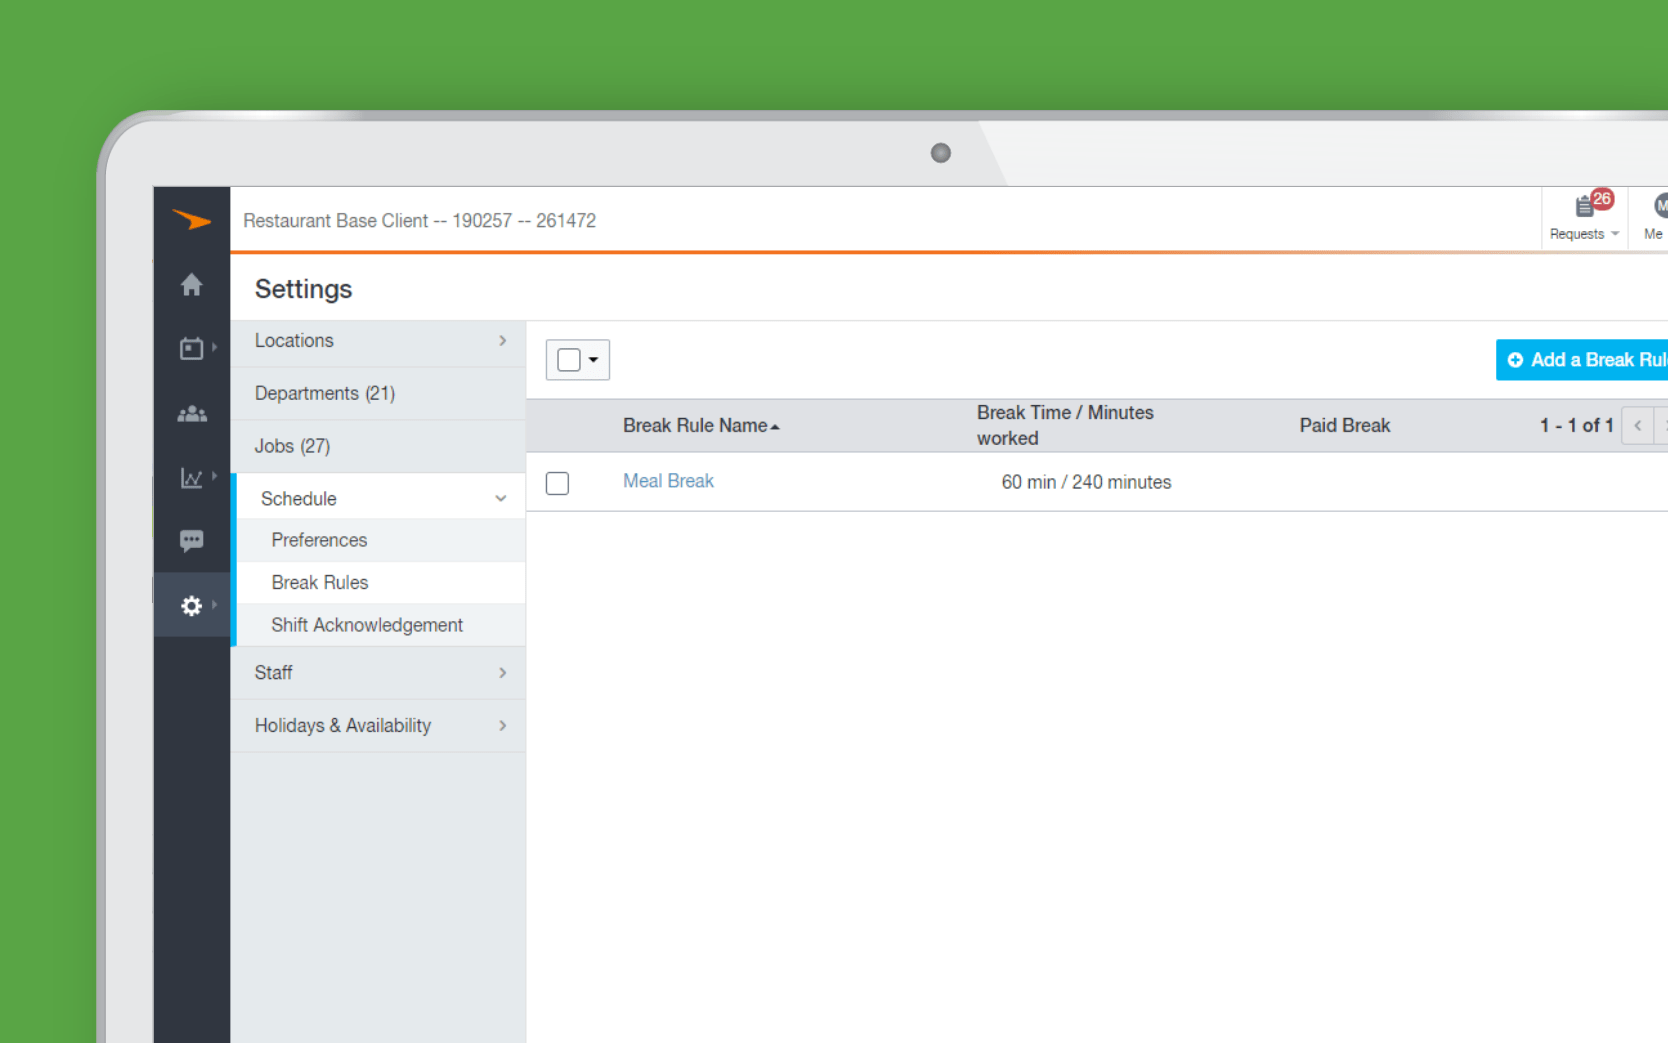
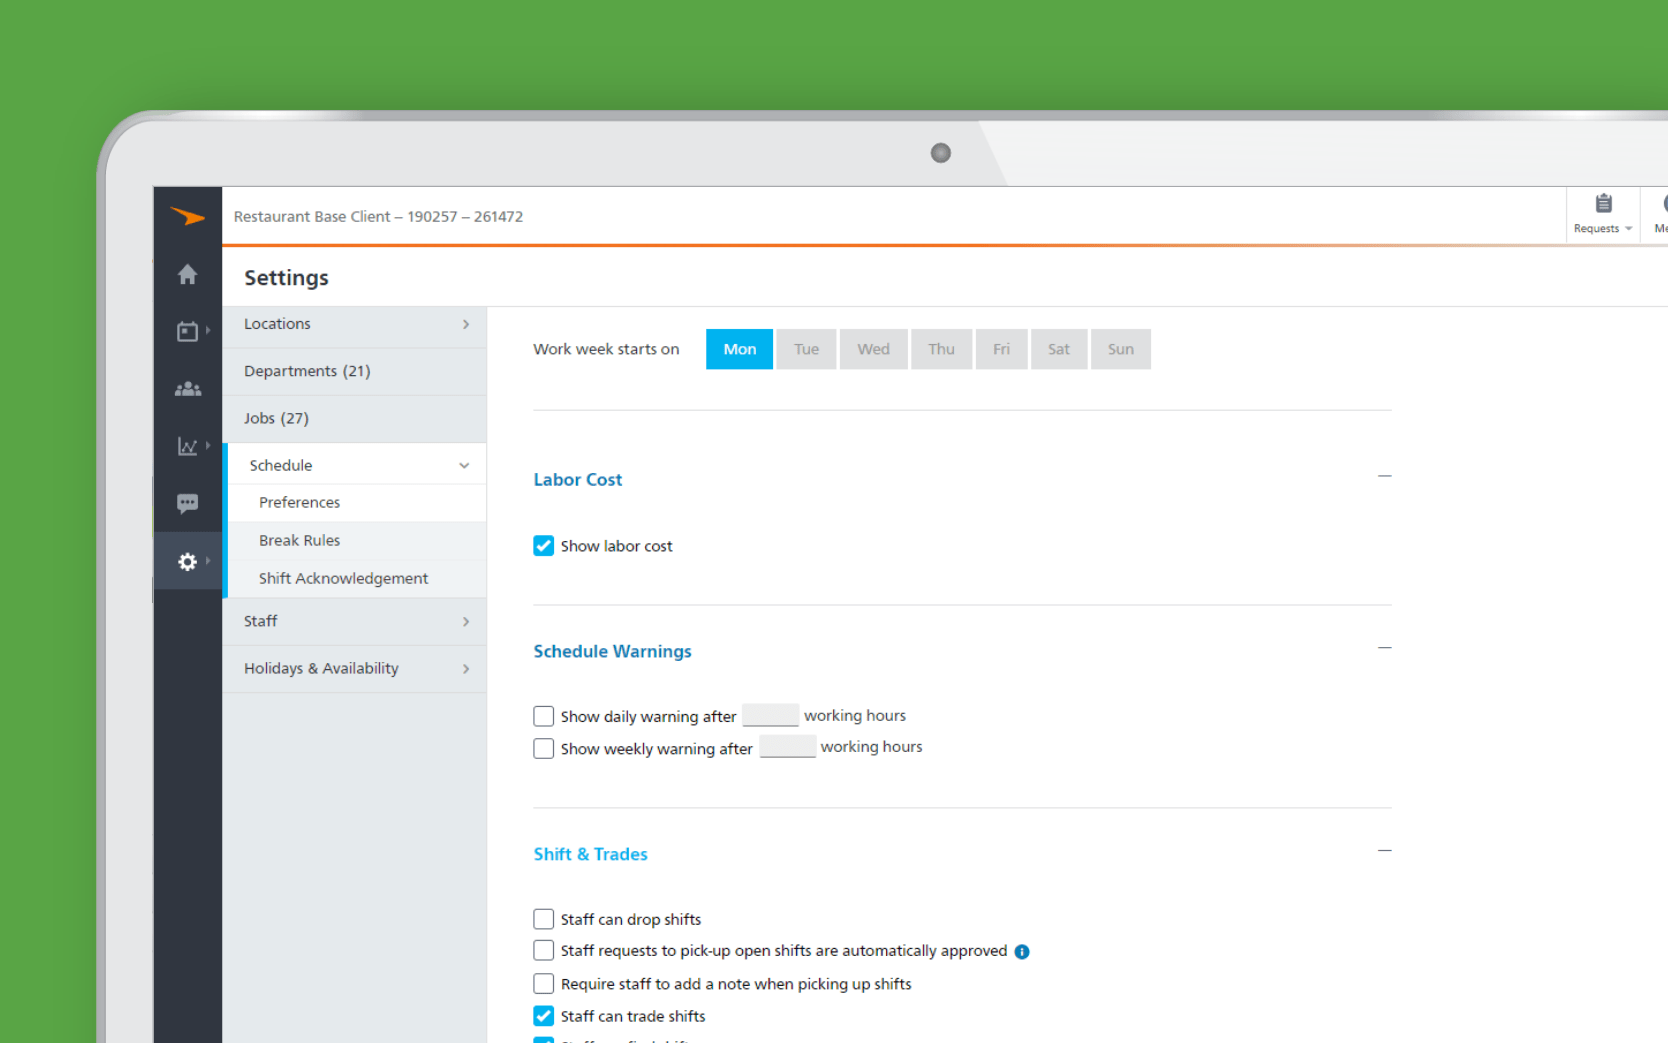
Scheduling Rules —
Take control of your scheduling needs by setting daily or weekly rules and creating minimum rest times.
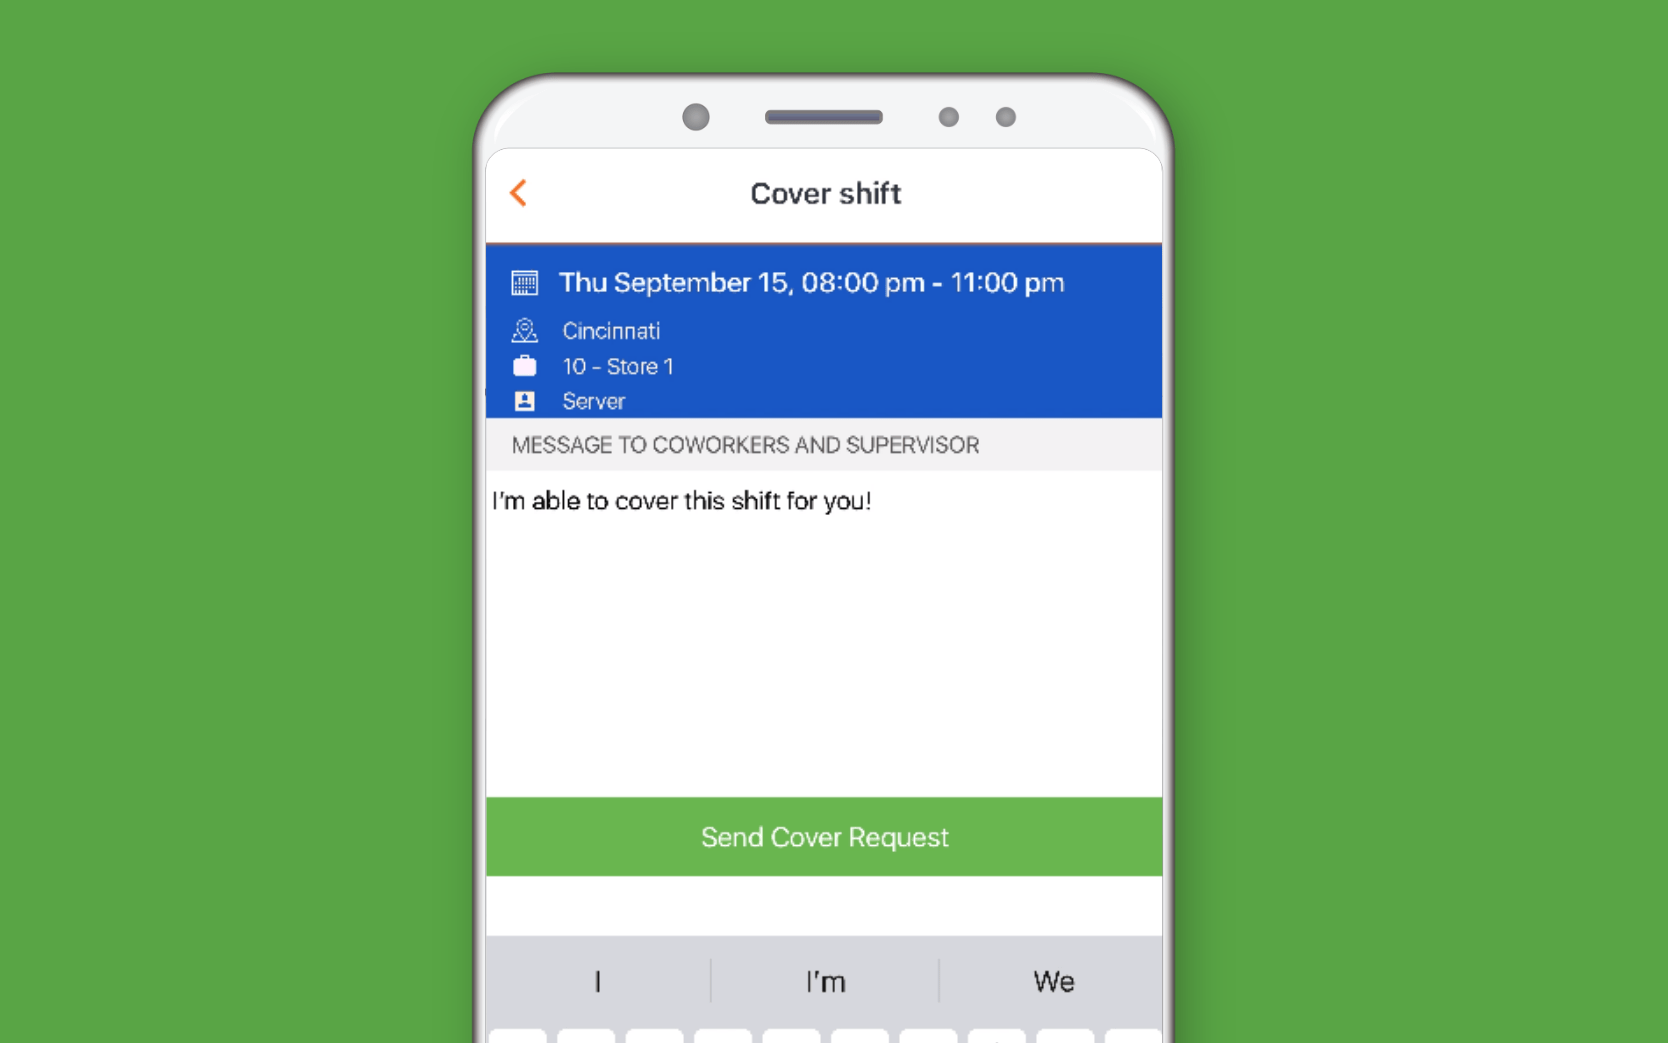
Engage Employees —
With mobile scheduling, employees can set their own availability, pick up or drop shifts in real time
Budget Planning —
Monitor schedules by shifts or jobs and establish budget caps to control labor costs and track daily expenses.
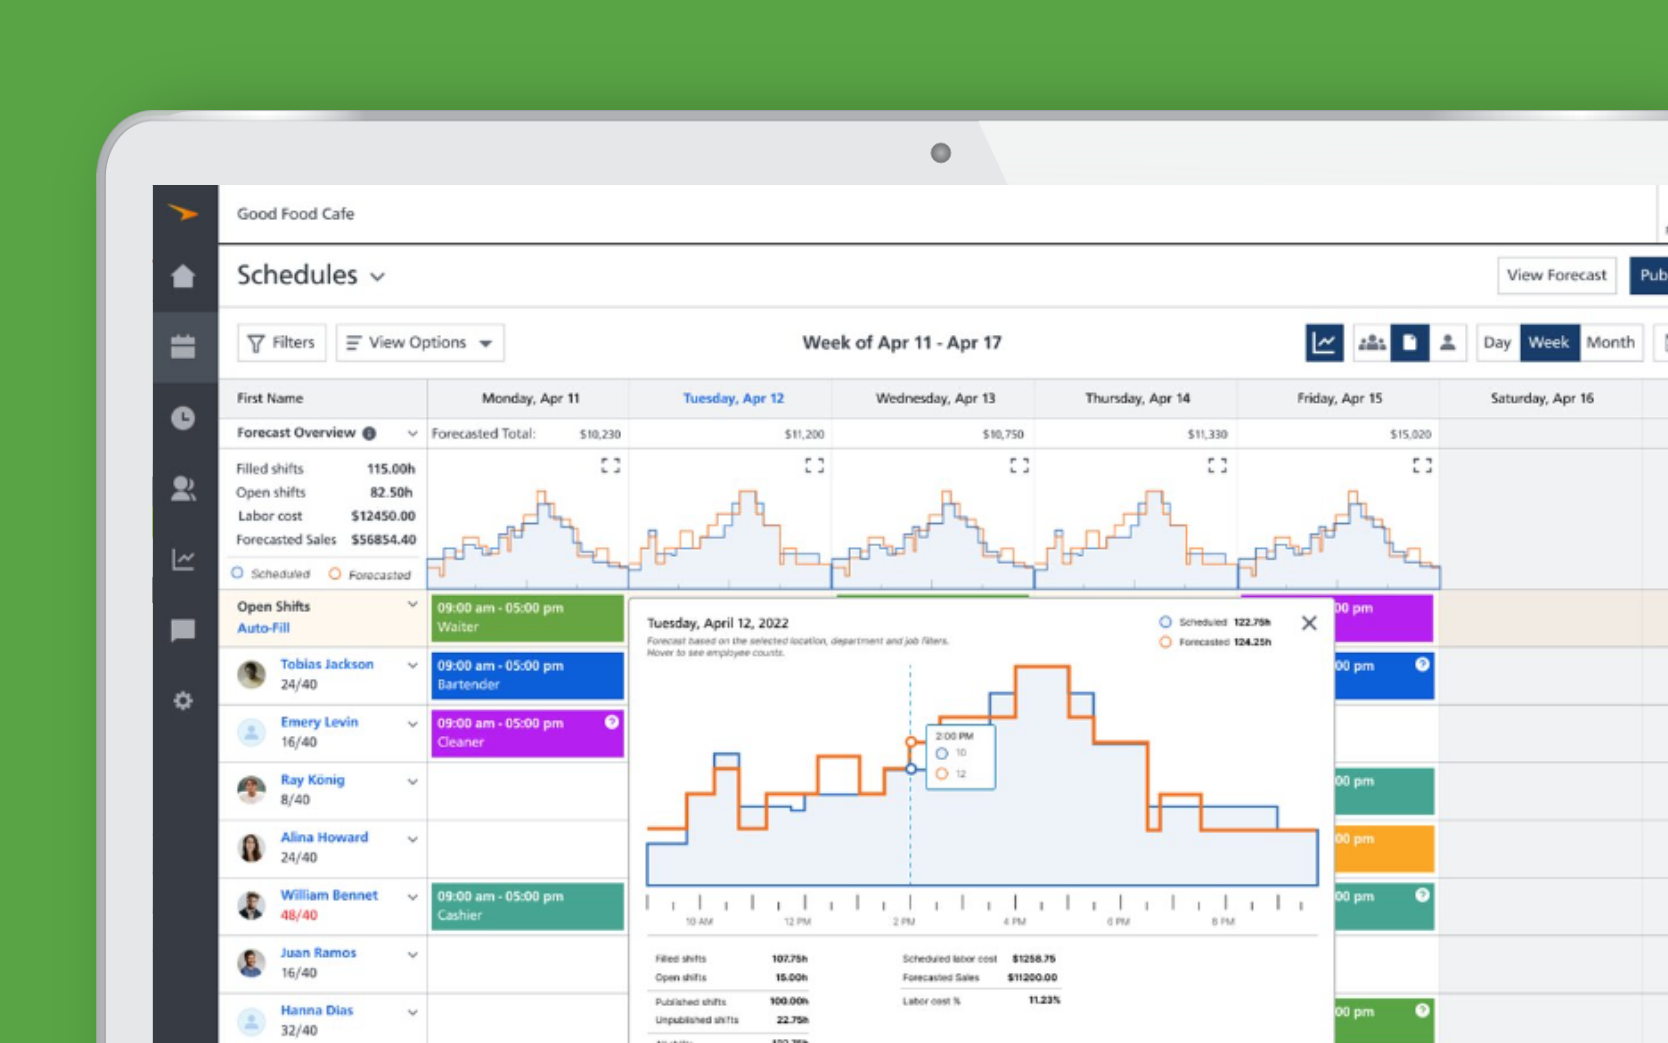
Labor Forecasting —
Make informed schedule decisions based on real operational data, ensuring that you have the right number of employees at the right time.
Configured for Your Industry

Recruit and hire skilled nurses, dynamically schedule staff, and boost engagement and retention with Paycor’s configurable software.


Recruit skilled labor, optimize coverage, and track and analyze labor costs with Paycor’s configurable software.


Speed up the recruiting process with same day hire, streamline with custom hiring workflows, offer workers OnDemand Pay and self-service on an award-winning mobile app.


Save time with a unified, mobile-first experience intuitively designed for leaders and gain deeper insights about your business with powerful analytics.


Maintain compliance, pay adjuncts and staff accurately and on time, schedule staff at multiple campuses, recruit qualified talents, and get up to speed faster with our industry-skilled implementation.


Recruit, onboard, pay, and schedule workers in a mobile-first environment. The last thing retailers need is a generic solution. That’s why leading retailers partner with Paycor.


Pay employees accurately and on-time in a heavily regulated tax environment. Overcome staff shortages, maintain tax compliance, and help tie operations to grant funding.

Easily Create Work Schedules
A quick and effective scheduling process is key to making the right business decisions, optimizing your staff and increasing efficiencies across your workforce. Paycor’s employee scheduling software enables HR leaders to create, manage and communicate employee schedules while empowering employees to view, manage and receive work schedule updates.
Paycor’s scheduling tool also offers leaders the flexibility to approve staffing changes and align job-based qualifications with the appropriate department or position to maximize budgets and optimize productivity.
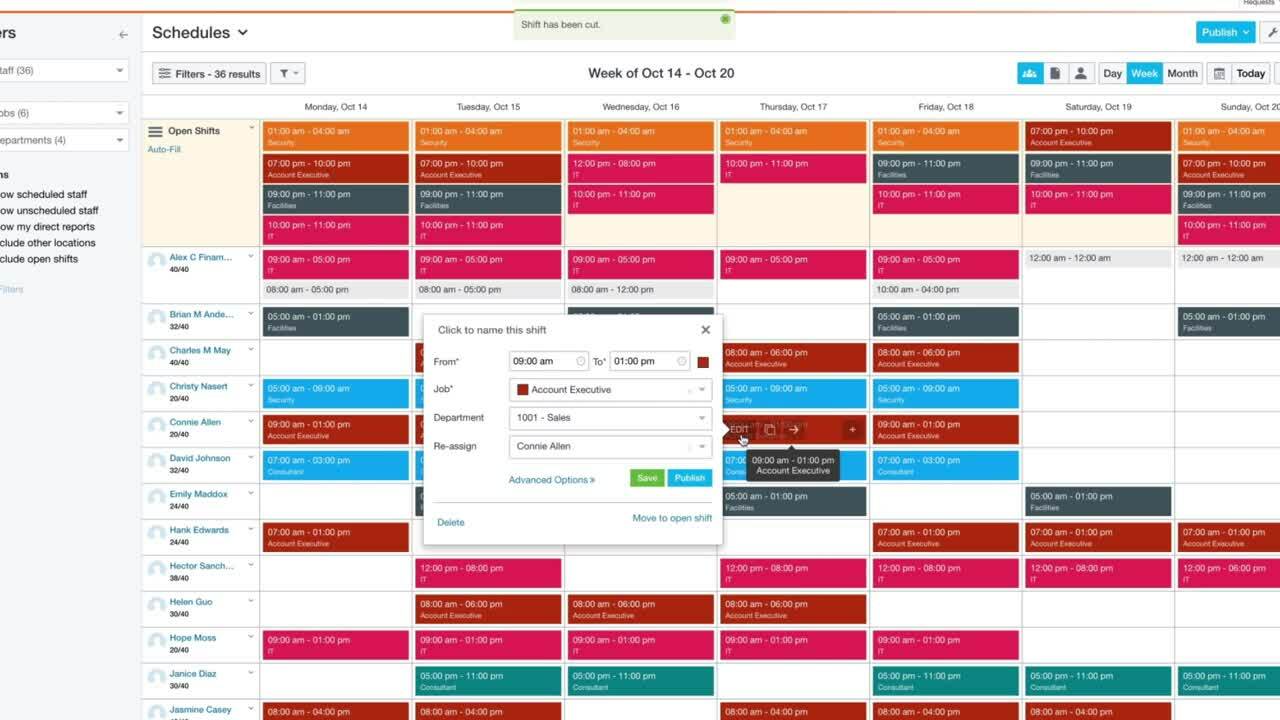
Automate the Scheduling Process
Take your scheduling out of Excel and leverage intuitive scheduling software that simplifies the entire process.
Get Everyone on the Same Page
Paycor Scheduling helps you ensure accurate coverage by allowing employees to proactively set their availability and communicate updates in real time.
Control Labor Costs
With budget capping and real-time data, we can help you dramatically reduce your labor costs, forecast expenses and prevent any surprises.
Scheduling Solution Trusted By Users & 3rd Party Evaluators


“Scheduling took me an entire week before Paycor. Now with Scheduling Pro, it only takes me 30 minutes to schedule my employees for the entire month.”
– Nicole M., Administrator, Mini University
Scheduling FAQs
Employee scheduling systems are tools used by employers to schedule work hours for their employees, and to give workers and managers visibility to the schedule. Scheduling systems often have additional functionality to allow the company to communicate changes, block out vacation time, holidays, and shift swaps.
Employee scheduling is often a juggling act between an employers’ need to ensure they have the right number of employees on the floor during certain shifts with employees’ needs for personal time. Scheduling software gives both employers and employees visibility to shifts and allows for easier scheduling processes for both.
Employee scheduling software makes scheduling more efficient, fair and less personal for both employees and employers. Businesses can post shifts far in advance and schedule employees based on their preferences. Most systems also allow for self-service functionality, giving employees the ability to swap shifts, request shift pick-ups and more.
Small businesses should look for the following characteristics in scheduling software:
- Ease-of-use for both managers and employees
- Both web and mobile functionality
- Integrates smoothly into your time and payroll systems.
- Allows pre-built templates
- Employee access for schedule requests
Managing employee shift schedules in ways that both keep your business running and respect employees can be challenging. You should be careful to keep long shifts and overtime to a minimum, and to give employees plenty of notice about their shifts to help them manage their personal lives. Having a visible calendar of future shifts, using a scheduling system, is a great way to keep shift scheduling predictable.

Resources
Struggling with unexpected absences, tardiness and lapses in communication? Discover how the right employee scheduling software can boost engagement, improve productivity, and create efficiencies across your workforce.
Live Webinar
Health & Wellness Series: Navigating Burnout & Cultivating Resilience
In today’s fast-paced and demanding work environment, burnout has become a prevalent issue affecting individuals across various industries. This webinar aims to provide valuable insights, practical tips, and actionable solutions to help individuals effectively manage and overcome burnout.
2:00pm ET, May 28th, 2024
Article
Read Time: 9 min
The Most Important Facts About Workers’ Compensation
Maximize the benefits of workers’ compensation insurance as an employer by knowing these key points.
Live Webinar
Senior Leadership Is the Problem… Now What?
Do you have executives who are behaving badly? Setting the wrong example? Destroying their own credibility? Creating unnecessary bottlenecks and backlash?
2:00pm ET, April 30th, 2024
Article
Read Time: 9 min
New York’s 2024 Workplace Compliance Updates for HR Leaders
Employers in New York are required to stay updated on the latest workplace compliance regulations. Discover some of the key compliance watch-outs to be aware of in this article.
Article
Read Time: 9 min
The Problem of Employee Tardiness in the Workplace
Employee tardiness is a major problem that costs businesses a lot of money every single year. Here are some actionable tips for reducing tardiness and absenteeism in the workplace.
Article
Read Time: 8 min
Making a Schedule for Employees
Creating a work schedule for employees is a balancing act of needs for the business and workers. Here you’ll discover how to ensure your business has coverage.
Article
Read Time: 5 min
3 Tips for Improving Staff Punctuality
Tardy employees can have a strong negative impact a business. Here are some great tips for improving staff punctuality in the workplace.